
FEDERAL BUDGET OVERVIEW:
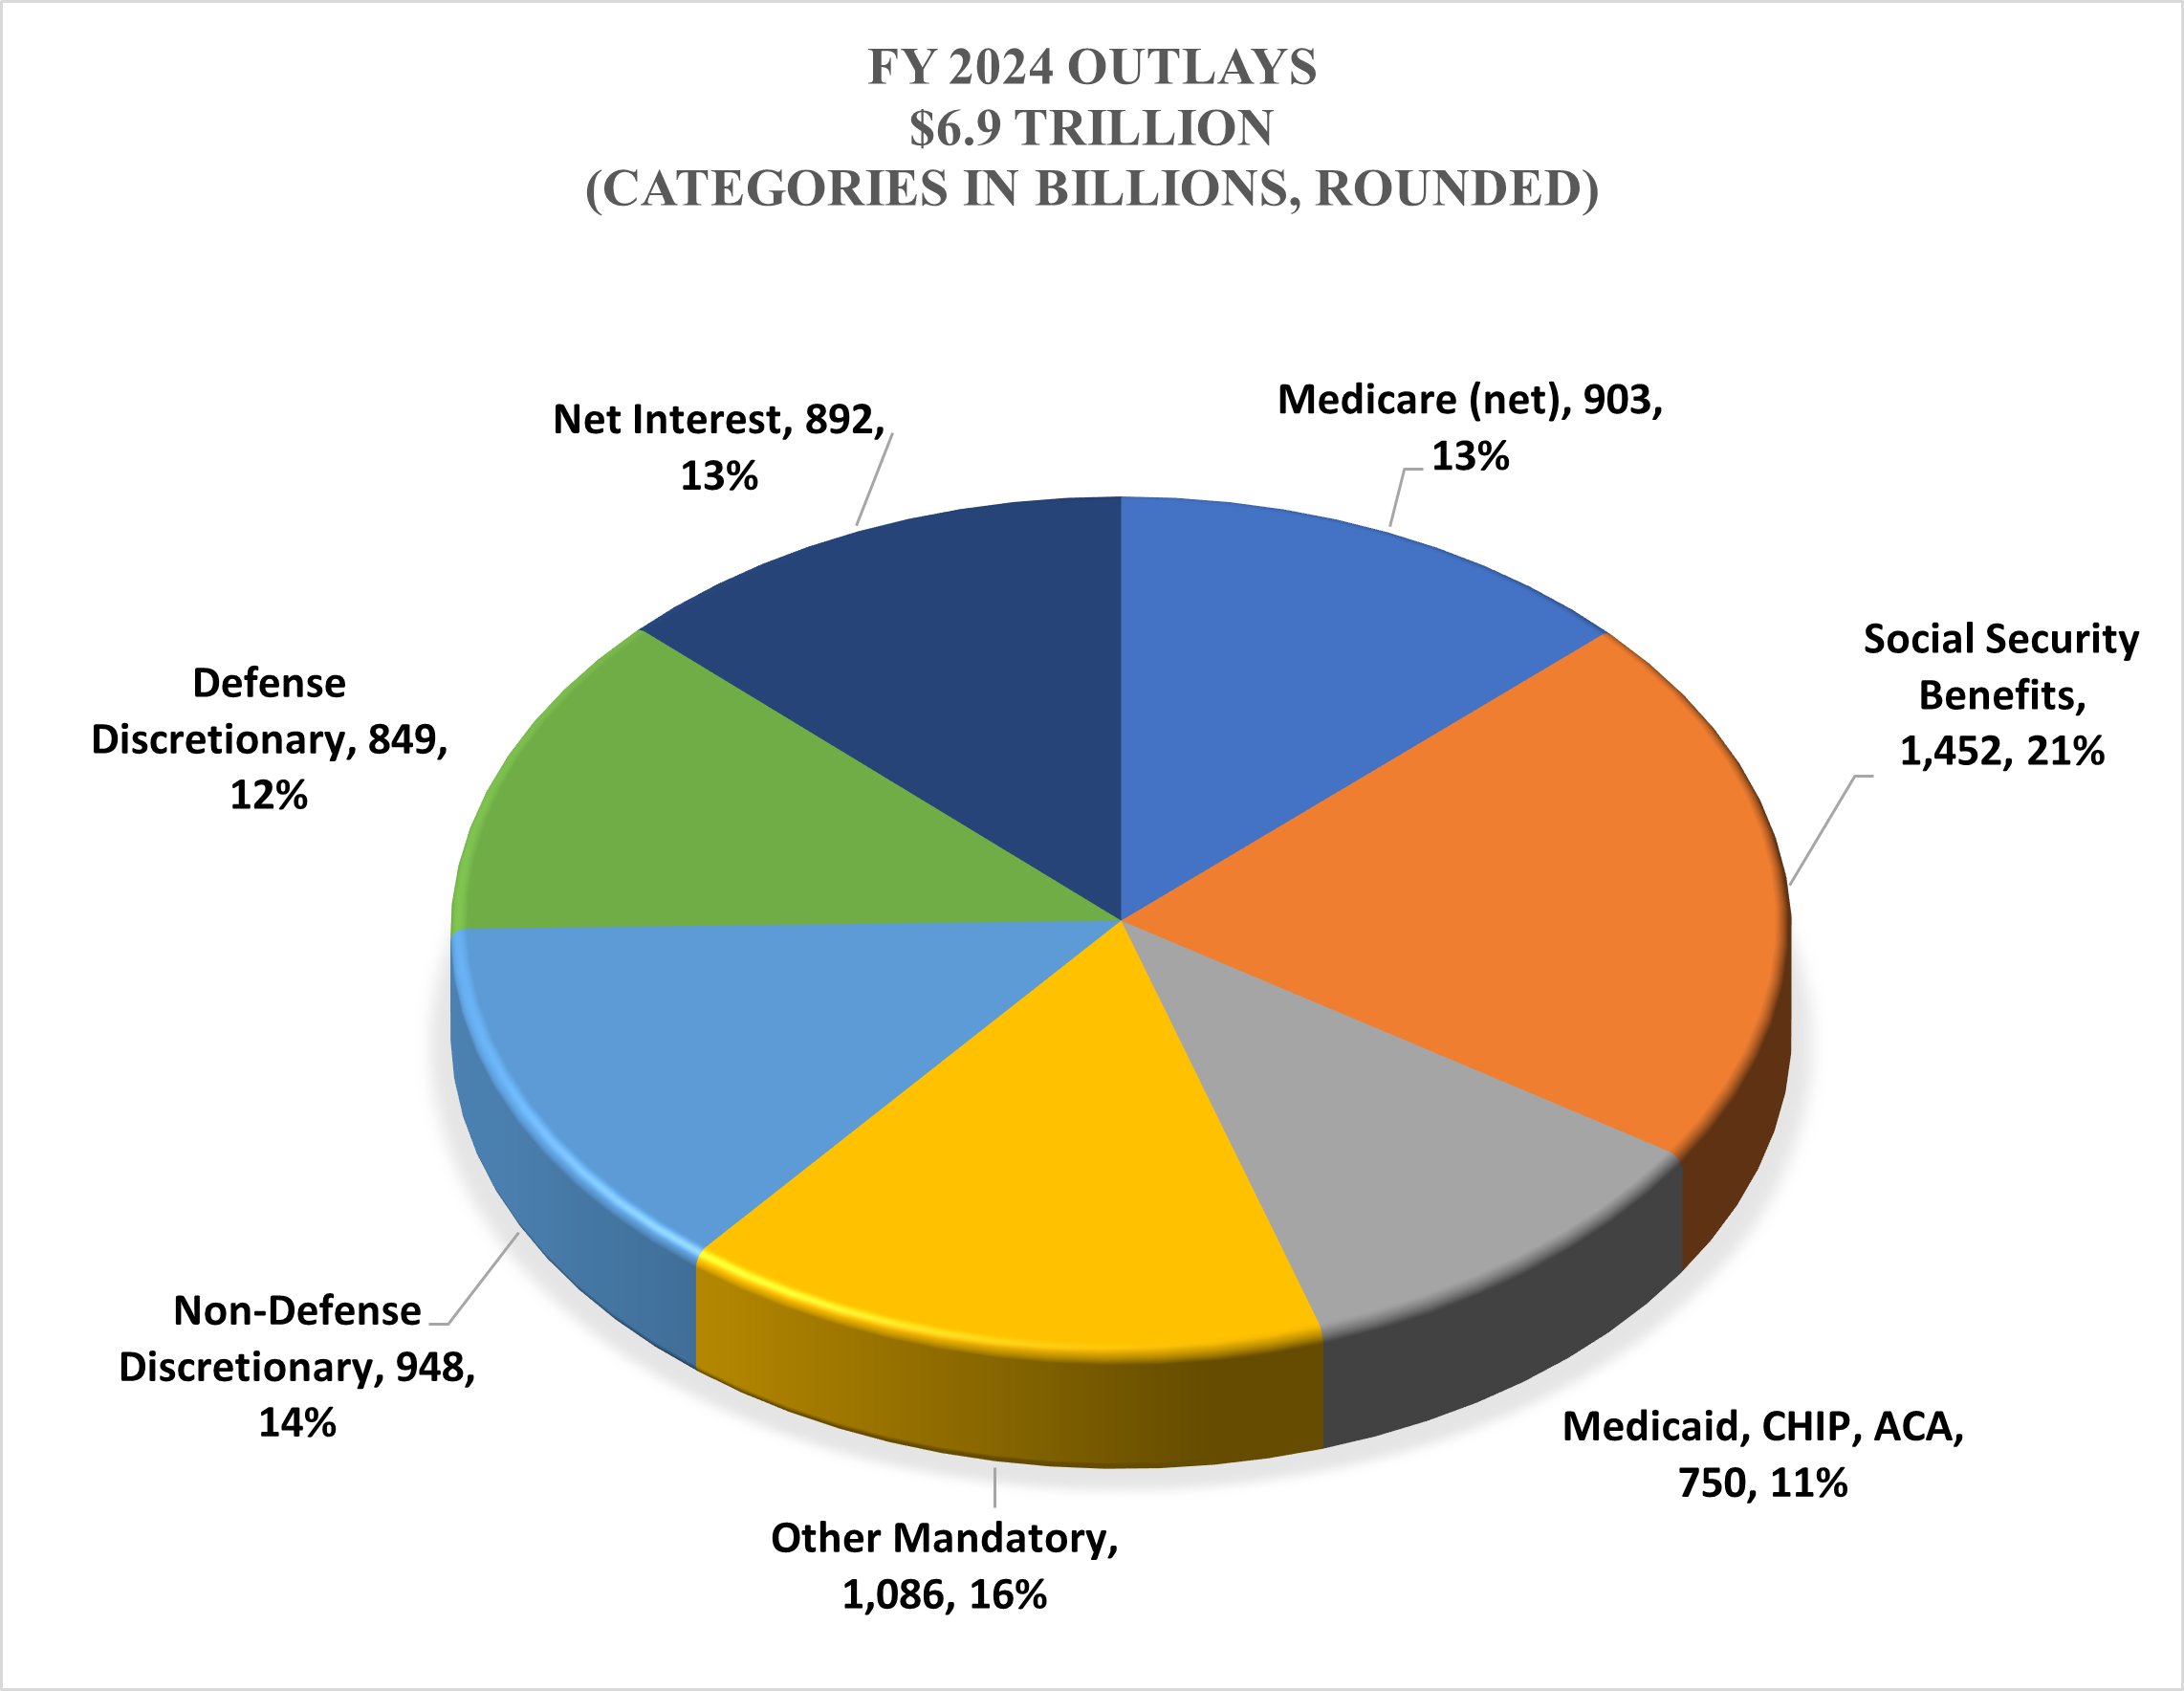
The federal budget divides nearly $6.9 trillion in annual federal spending into three broad categories as displayed below:
- discretionary spending;
- direct spending (Social Security, Medicare, Medicaid and other mandatory spending); and
- net interest payments on the debt.
Data Source: Congressional Budget Office, Budget and Economic Outlook (June 2024)
Discretionary Spending: 26% of the Budget:
- About 25% of federal spending is called “discretionary spending,” because the amount of spending flows from annual discretionary funding decisions by the House and Senate Appropriations Committees.
- Defense discretionary spending is $849 billion in projected outlays for FY 2024, or 12% of total outlays. It is funded by the Defense Appropriations bill and other appropriation bills that fund military construction and atomic energy.
- Non-defense discretionary (NDD) spending is $948 billion in projected outlays for FY 2024 or 14% of total outlays. NDD is funded by the 11 non-defense appropriations bills. Non-defense discretionary spending has been trending downward, except for temporary increases due to the Great Recession and COVID-19 response efforts. As a percent of GDP, non-defense discretionary spending was 4.4 percent in FY 2010 and fell to 3.1 percent of GDP by FY 2019. Due to the COVID-19 pandemic response, NDD rose to 4.4 percent of GDP in FY 2020, but fell to 4.0 percent in FY 2021, 3.8 percent in FY 2022, and 3.6 percent of GDP in FY 2023.
Direct (Mandatory) Spending: 61% of the Budget
- The largest block of federal spending— about 61% and $4.191 trillion in FY 2024—is called “direct spending” because the outlays flow directly from legal obligations of the federal government established in authorizing laws. Direct spending is also referred to as “mandatory spending” because it is mandated by legal obligations written into law (such as Social Security benefits).
- Most direct spending is comprised of “entitlement programs”—where eligibility rules, benefit formulas and inflation adjustments enacted in permanent law determine annual outlays. Consequently, entitlements and other direct spending programs are on “auto-pilot” until underlying laws are changed.
- The three largest entitlement programs, together comprising 45% of the budget, are Social Security, Medicare and Medicaid.
- Social Security: nearly $1.5 trillion in outlays and 21% of the budget, pays old-age, survivors, and disability benefits from payroll tax receipts and trust fund reserves.
- Medicare: $900 billion and 13% of the budget is the national health insurance program administered by the federal government for seniors and disabled adults, and financed by payroll taxes, premiums, copayments, and general tax revenues.
- Medicaid: more than $600 billion in outlays and 9% of the budget, is the major health and long-term care program for low-income children, families, and seniors—financed jointly by the federal and state governments and administered by the states.
Net Interest Payments on the Debt: 13% of the Budget and Rising
- The third category of federal spending is “net interest,” projected to be $892 billion in FY 2024, nearly 13% of total federal outlays.
- Because of the rapidly rising public debt, net interest is projected to become the fastest growing portion of the federal budget, reaching $1 trillion per year by FY 2026 according to the Congressional Budget Office.
As displayed in the figure below, federal revenues consist of governmental receipts from the individual income tax, payroll taxes, corporate income tax, federal reserve remittances, excise taxes, custom duties, and the estate and gift tax. Revenues in FY 2024 are projected to be $4.9 trillion.
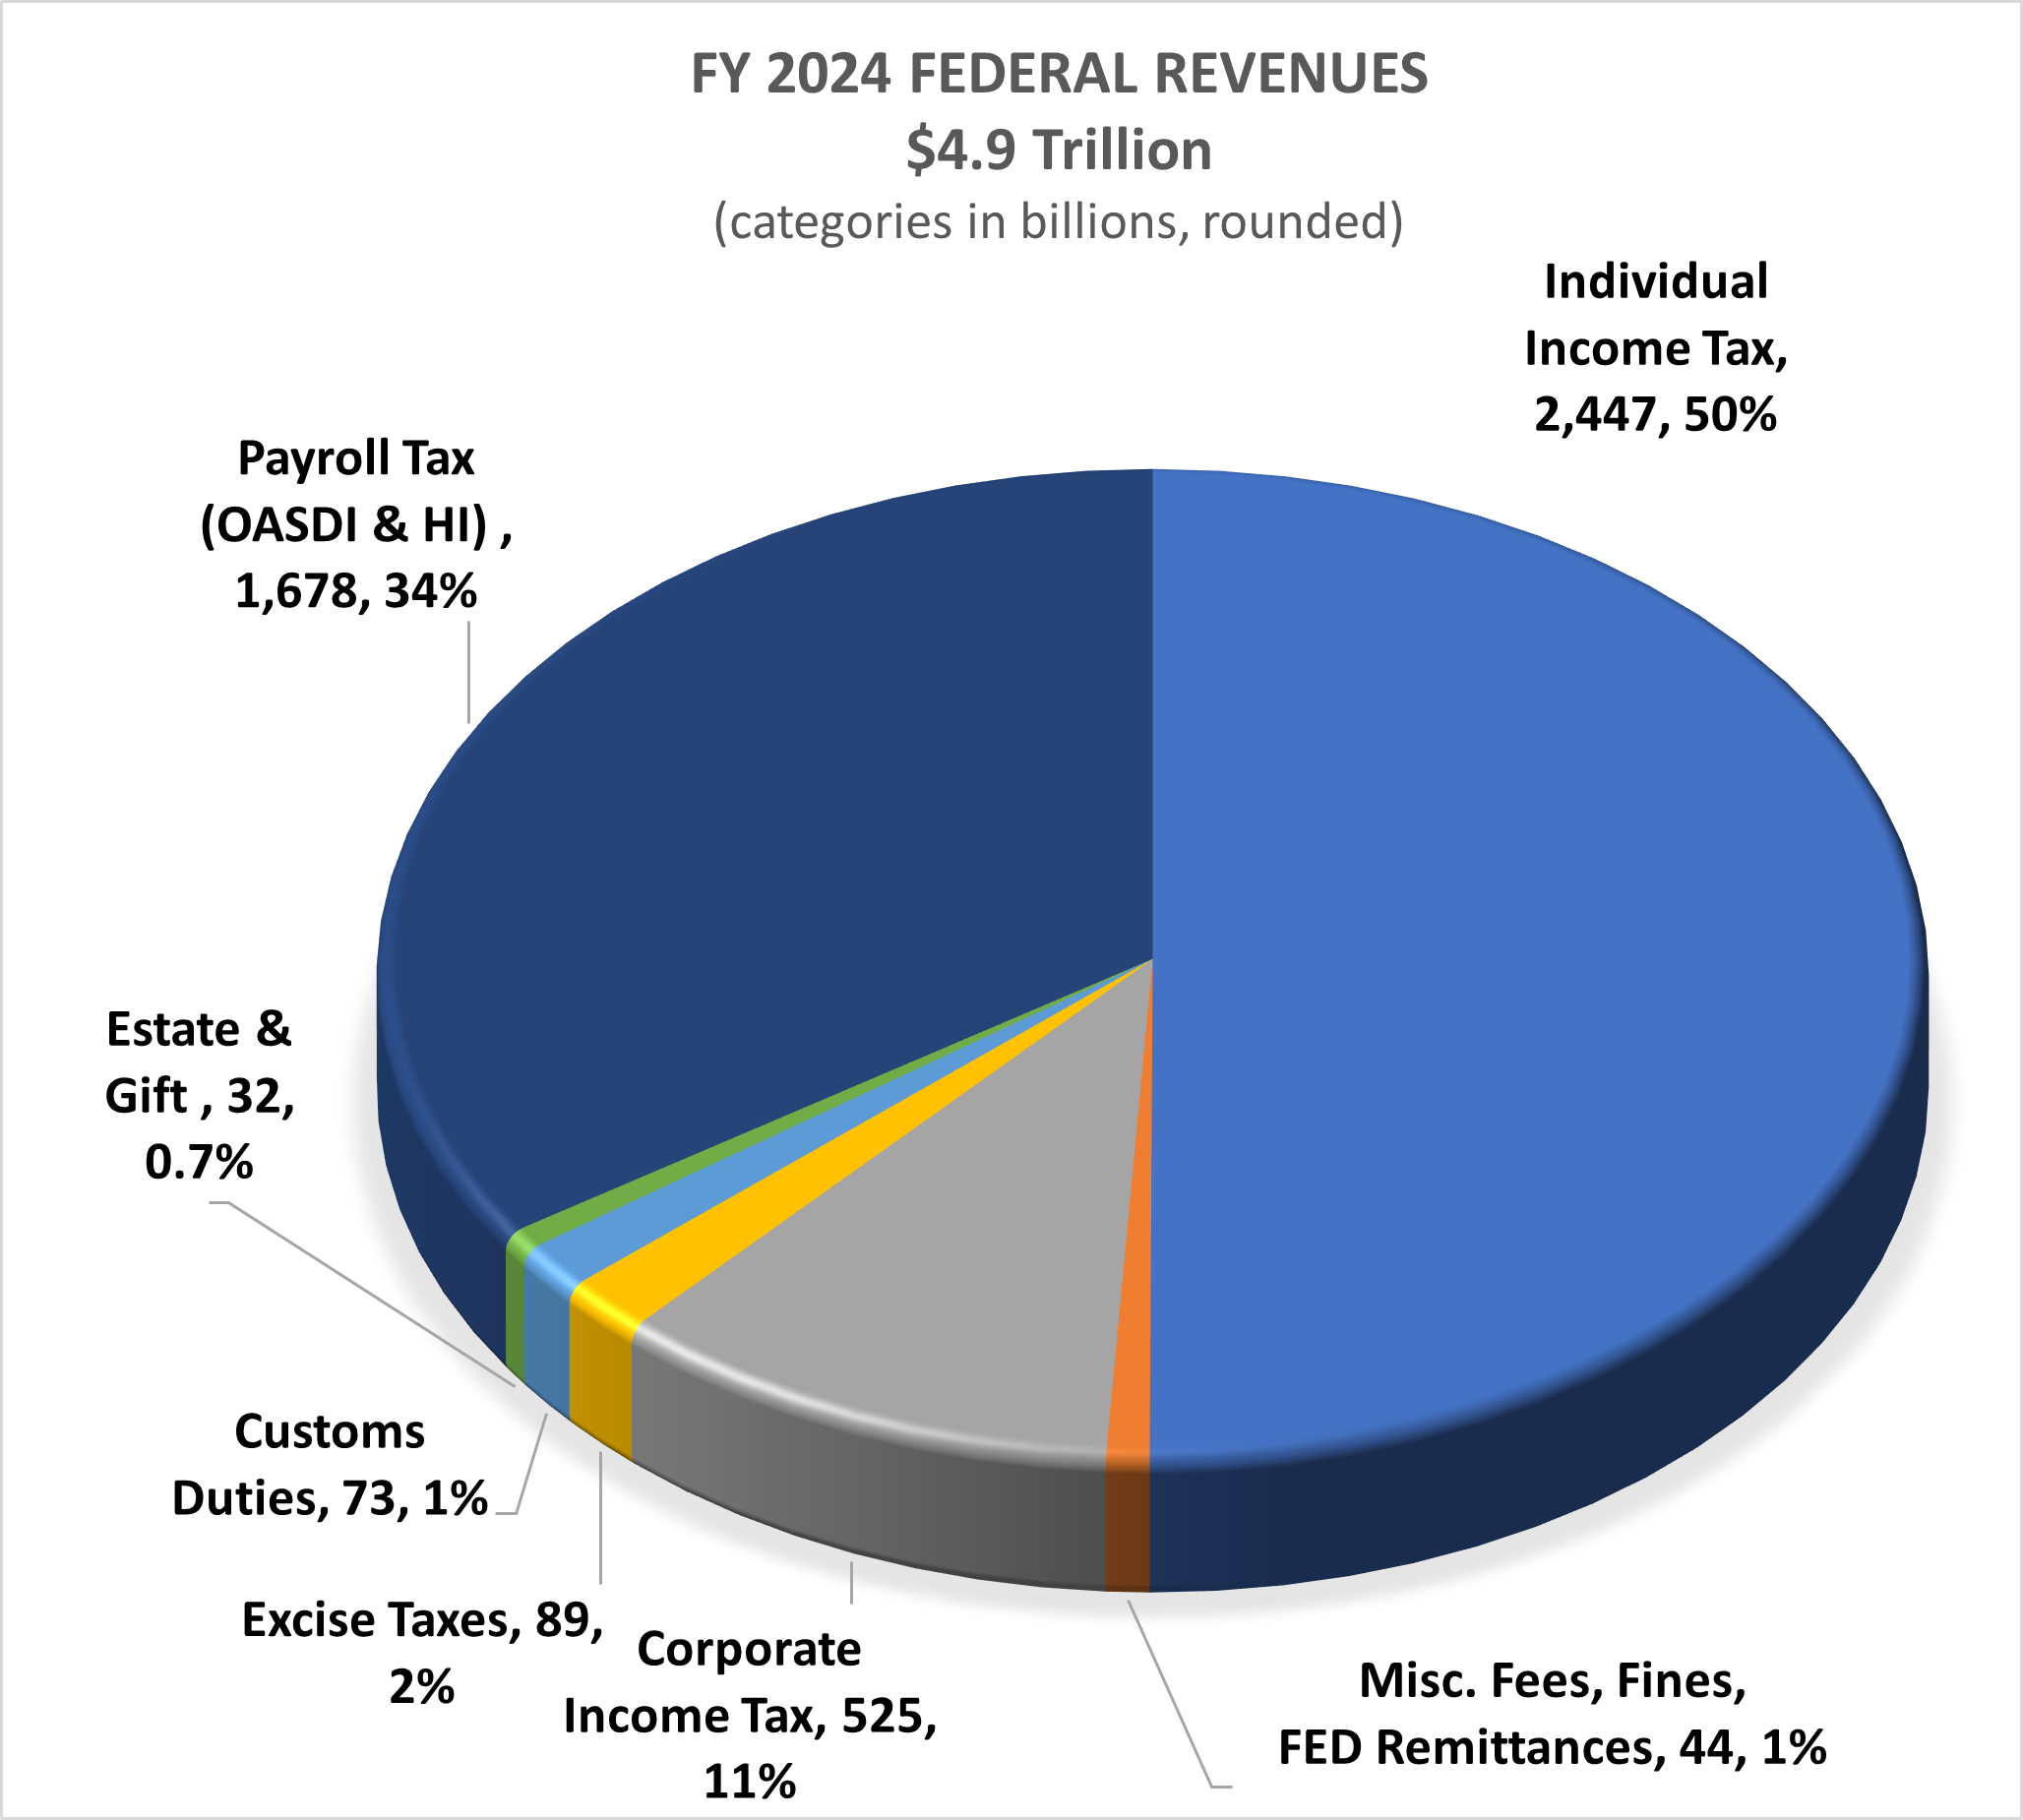
Data Source: Congressional Budget Office, Budget and Economic Outlook (June 2024)